Price wilted toward the end of last week and things are not so clear. End of quarter/ monthly flows played a part in the revival as posted ahead of time on this site. This week will be crucial, and both the Dollar in its current flux and Yen have the opportunity to be ‘king maker’ in this pairing .
We started the week with a bullish bias. The daily chart gave an inkling of intent that the downside could see some respite. A bullish outside Candle hinted that a fight back was probable after a series of weaker prints.
The chart reposted below – Posted on the live news feed last week.

USDJPY Daily 25 March
This led myself and a few of the guys here to trade long. It certainly changed my outlook from a fence sitter to a dip buyer from last Monday. A few decent trades were had, yet I’m not convinced it’s going to be plain sailing into next week.
I have no more of an idea than the next person as to where we go from here. .I will post my chart below marking my parameters.
I always attempt to keep my thinking simple when faced with a situation like this. If price stays in the zone ( grey area on chart ) above 105.90, I am a dip buyer. — Price goes below, and I am not automatically a seller . More of a watcher until one side of this particular coin / pair shows its hand once again as it did so tellingly last week .
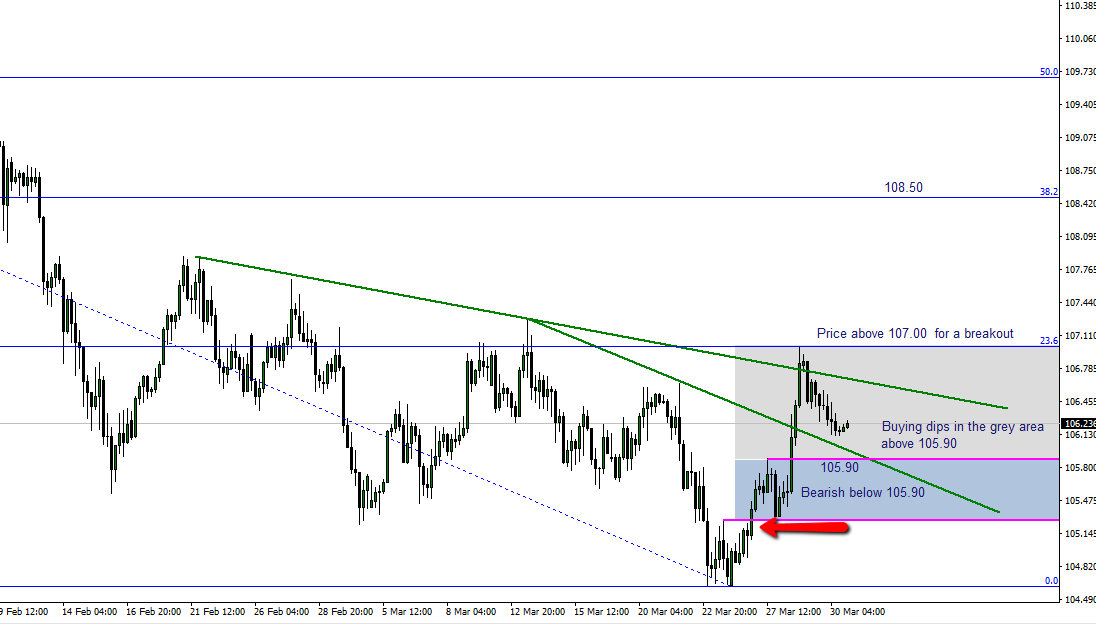
USDJPY H4
As always, I wish all our friends here the best of times for the new trading week .

Philosophy: "Trading rules.....it most certainly does"
Read how Horatio got into trading here
- Silver – This weeks shining star, as predicted by ForexFlow - July 19, 2019
- 新年快乐 财源滚滚 大吉大利 A Happy wealthy healthy New Year to all our Chinese friends - February 4, 2019
- Gold and Silver – Glittering prizes? - January 28, 2019
Hola Horatio, Happy Easter! How have you been?
I picked this last week from Yogi on Twitter.
Morgan Stanley targets USD/JPY 110.00 entry at yesterday’s close with Stop Loss at 105.20 Date: March 28th, 2018 via Yogi Chan, TWTR: @Yogi_Chan
Also, BofAML has been calling 111s and later a move to 117s based on the impact Trump’s Tax Cuts are going to have on the US Dollar – however I settle somewhere around 110s
Your thoughts? Also, 50-EMA on the Monthly Chart gravitating near 108.80 strikes as tough wall to crack.
https://uploads.disquscdn.com/images/40267e9e639b8c9ae7c138e952021fcd9aa74956c5830eba8229da6fbc2f9823.png
Ahoy Hola Jose…… Mr Brazil
I am wonderful thank you my friend. I hope you are having a lovely Easter holiday.
Every longer timeframe chart that i look at points to indecision. I am more of a scalper/ shorter term trader as you know, and therefore don’t like to corner myself into making the big calls . It’s interesting to look at your MA’s as I do not use them myself . Yes : I agree this could be a turning point for USDJPY. There is always a wild card in any trade and it is so very difficult when we have to factor in geopolitics, trade disputes along with the omnipresent central banker rhetoric .
My way of playing this ( to the long bias ) would be to open small positions and build . Small positions are easily absorbed if you are wrong . If you are looking at a +500 move then adding in steps and placing stops at every position break even would be my way of trading it . ?