
Cable on a rip and taking the crosses along for a bullish ride .
GBPUSD is looking strong. We are toying with a long standing trendline (green line) going back to July 2014. If we manage to hold the line here things could heat up with not a lot to get in its way near term. The September highs are the next target and that would clear the way to the 61.8% of the July 2014 high – Jan 2017 lows (yellow band).
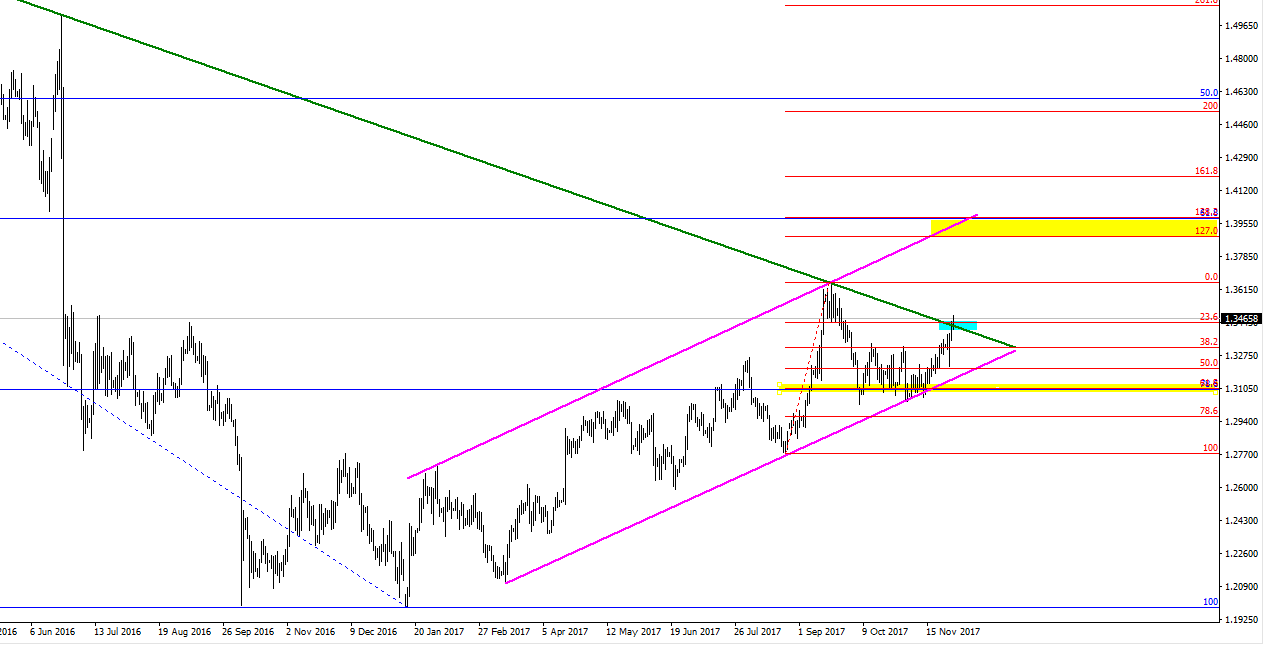
GBPUSD-Daily
GBPNZD has broken from an inverse head & shoulders pattern in classic style with a retest of the neckline. Price has a free run from here all the way up to the 1.9900 area (blue band) if we can keep the momentum, This level fits with a little resistance and is also the 61.8% of the August 2015 high to November 2016 lows. Without wanting to get ahead of myself here, the H&S patterns measured move is much higher. I will update this one if the first target is met .
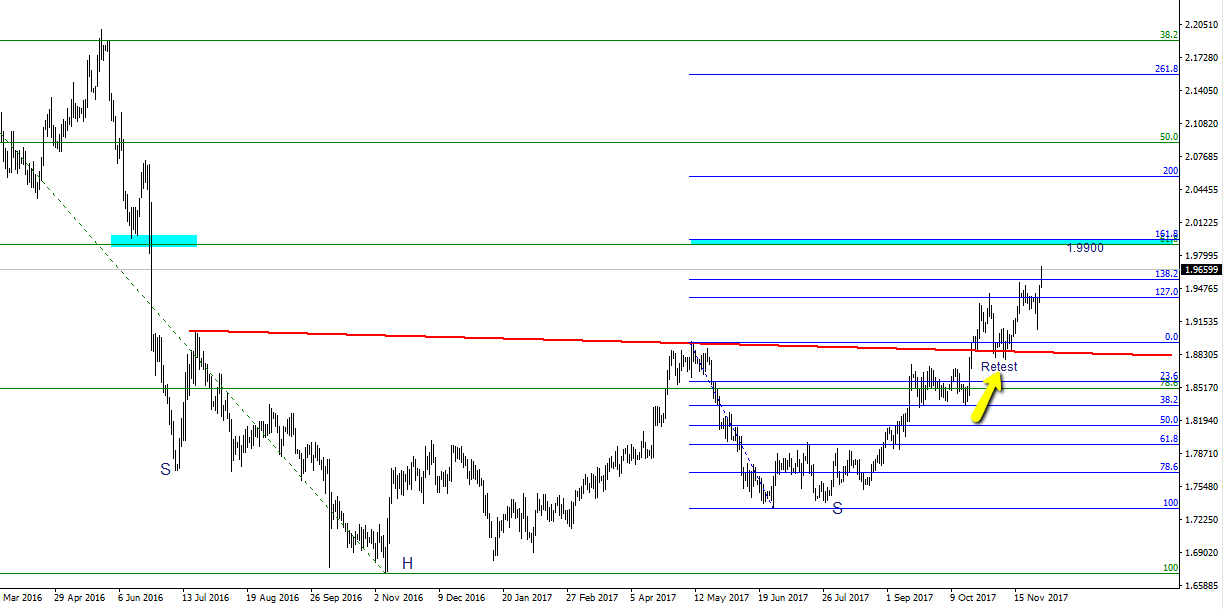
GBPNZD-Daily
GBPCAD has broken a decent historical support resistance level (blue band) marked by the arrows. I was lucky to spot this one early and traded long from the level. Approaching a little traffic shortly if the move stays positive, though not much to stop it if we can gain on current momentum. Notice how past price action has built on the move when crossing the blue support/ resistance area (red arrows). It may also be worth keeping an eye on the level (1.7170) for a retest and long position if you are not in this one already .
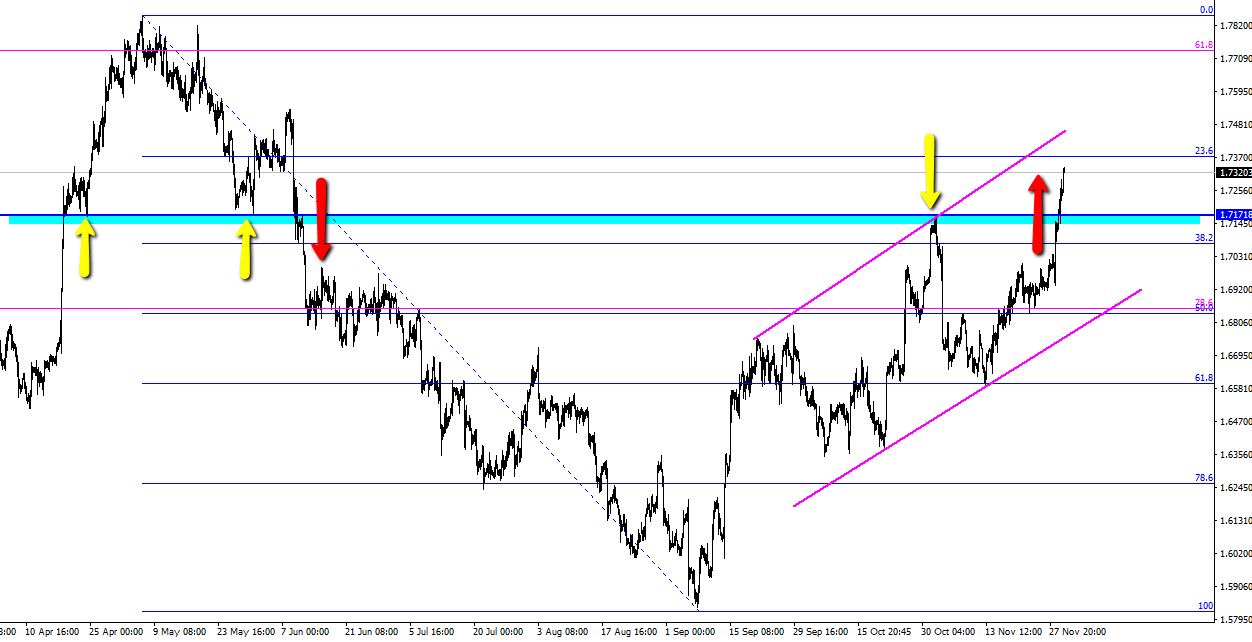
GBPCAD-H4

Philosophy: "Trading rules.....it most certainly does"
Read how Horatio got into trading here
- Silver – This weeks shining star, as predicted by ForexFlow - July 19, 2019
- 新年快乐 财源滚滚 大吉大利 A Happy wealthy healthy New Year to all our Chinese friends - February 4, 2019
- Gold and Silver – Glittering prizes? - January 28, 2019
Just a few days ago GBPUSD was negative for the entire month of November!
Indeed LD
Amazing what a few days and some headlines can do 🙂