
A few charts to show the importance of that area 18.01.2018
From the H4 to the monthlies , there different fibonacci’s and trend lines all converging in the 1.2155/70 zone . On the H4 we have the 38.2% of the latest move higher at 1.2173 or 1.2167 depending on which low we take. We can also see on the same chart a rising trend line from Oct last year, coming in around 1.2160.
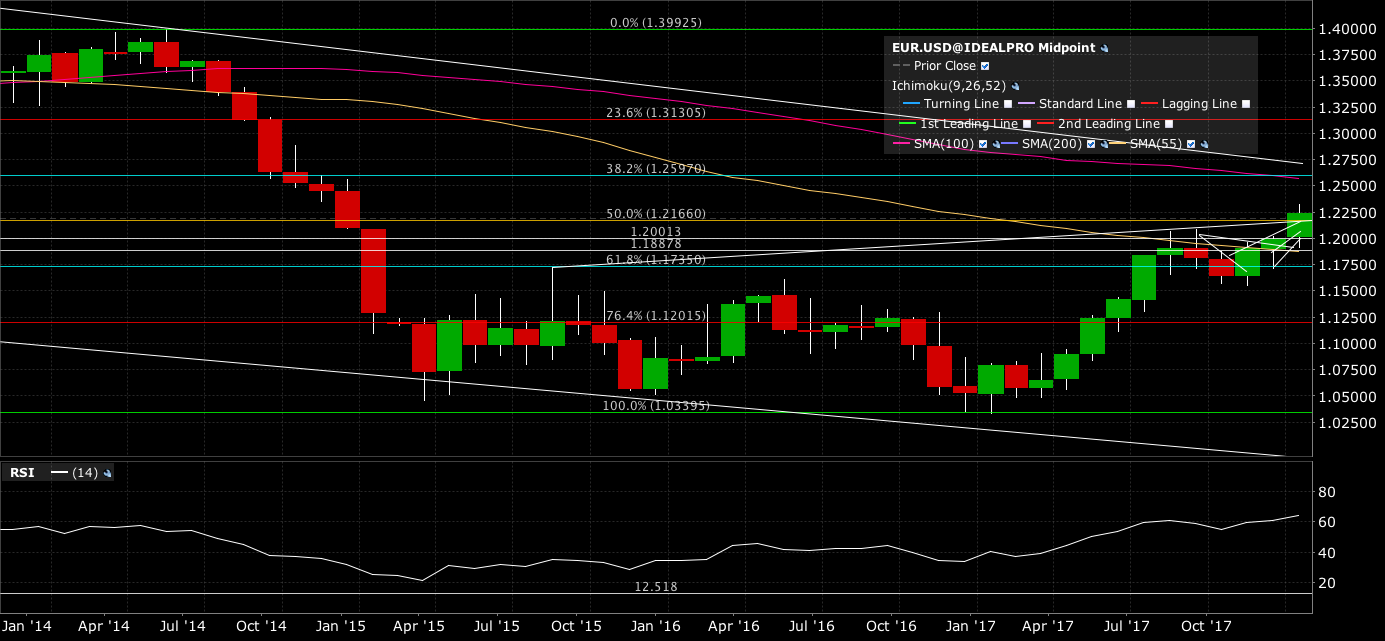
On the dailies, we have a rising trend line from August 2015 over the September 2017 high also coming in around 1.2160.
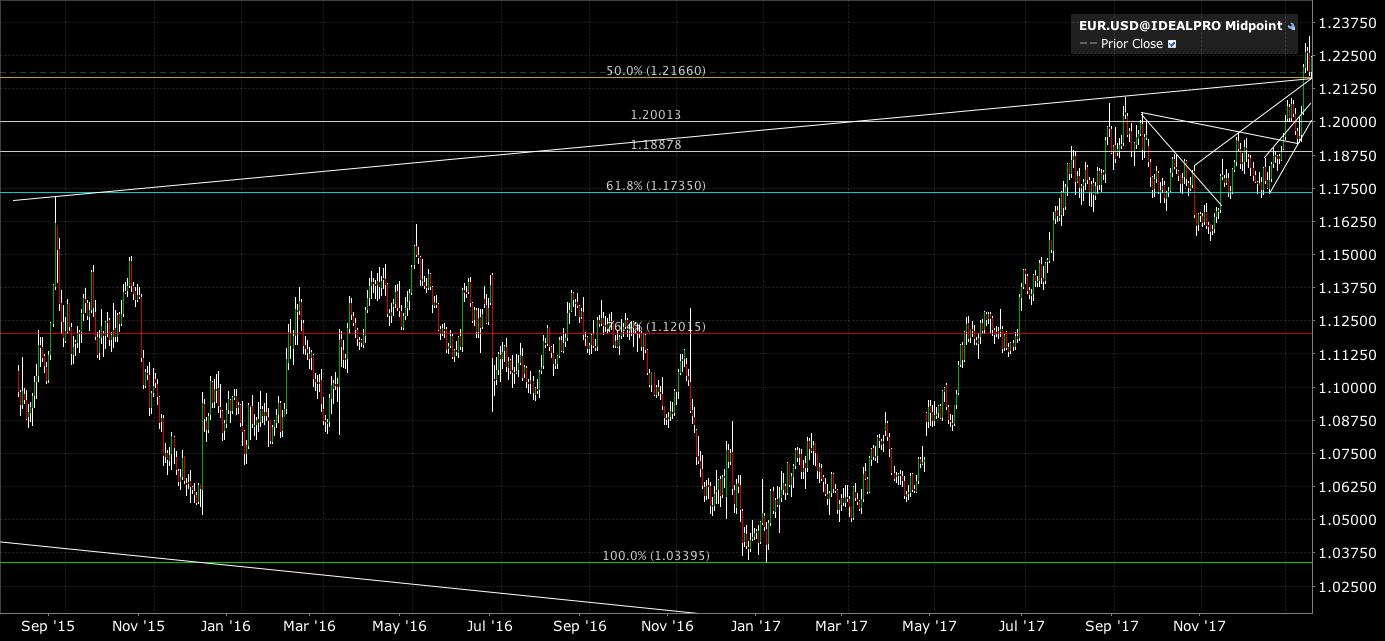
And finally on the monthlies. we have the 50 % Fibo from the 2014-2016 decline at 1.2166. Yesterday’s low on the fierce reaction drop stopped right at 1.2165.
I’m still a USD bear as I think there’s more going on than just barrier and stop hunting . The sharp moves we are seeing in between are due to algo’s, fast money and retailers jumping in/out all through the same gate all the same time, we better get used to them and trade accordingly, smaller and/or with tighter stops and targets. But underlying there’s a sense of real USD supply.
Levels deserve respect as showed many times in our posts here on Forexflow . So, I am tiny long already from 1.2210, I will buy dips down into this big support zone based on my USD view and the importance of the level. The ECB sent out its doves to try and stem the EURUSD rise but fact is we are holding retracements pretty well over all. But would it break, that would mean something bigger may be on hand and I won’t hesitate to flip the position around if fundamentals tell me so for a possible return to low 1.20’s.
Happy hunting
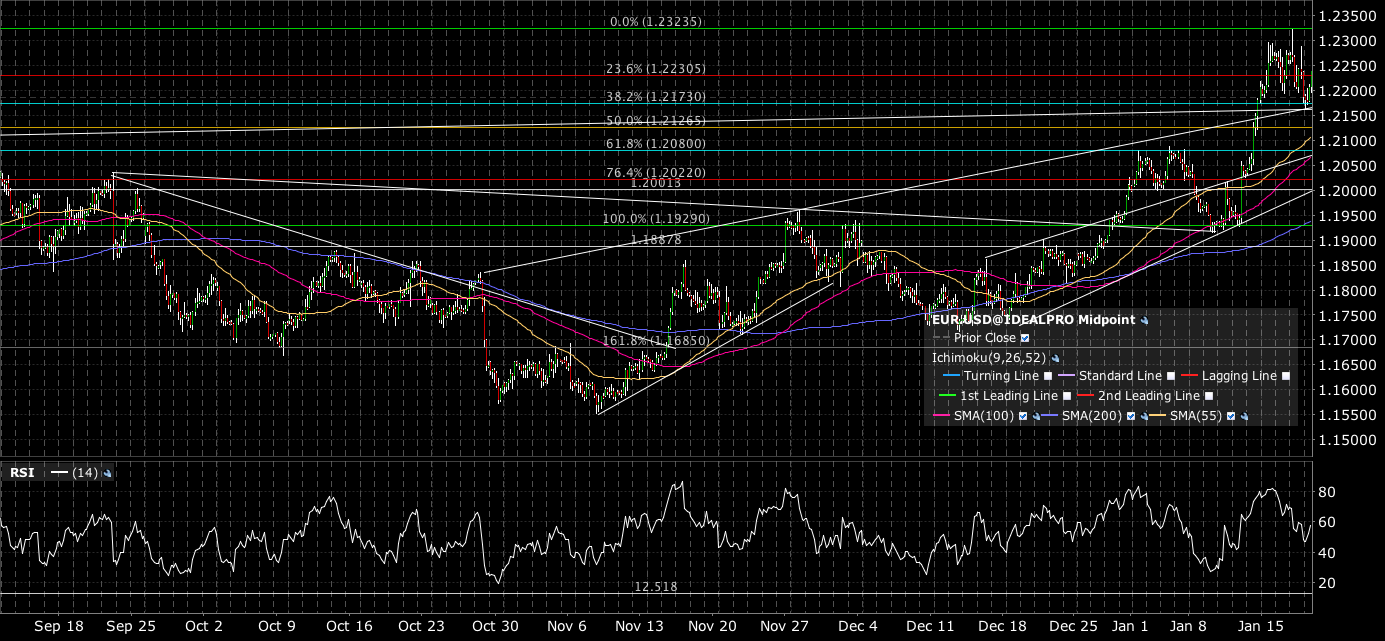
EURUSD H4 18.01.2018
EURUSD D1 18.01.2018
EURUSD M1 18.012018

- #Canada #Employment report preview. - November 5, 2021
- Rotation, ROTATION! - November 24, 2020
- $CNH living on hopium? Big week for the Yuan this. - January 13, 2020
Great analysis. I agree, even if USD staged a couple of strong rebounds the main levels are resisting, in EURUSD but also cable, USDCHF etc.
Great work K
Fine analysis Mr K, as ever.