
US Treasury Bond yield update
Now that 2 and 10 year differentials with Europe are pretty much toast as an indicator for spot, i’d like to highlight something. #TopDowncharts have a great deck this week on DXY – these guys have some of the best macro charts around and I strongly recommend them.
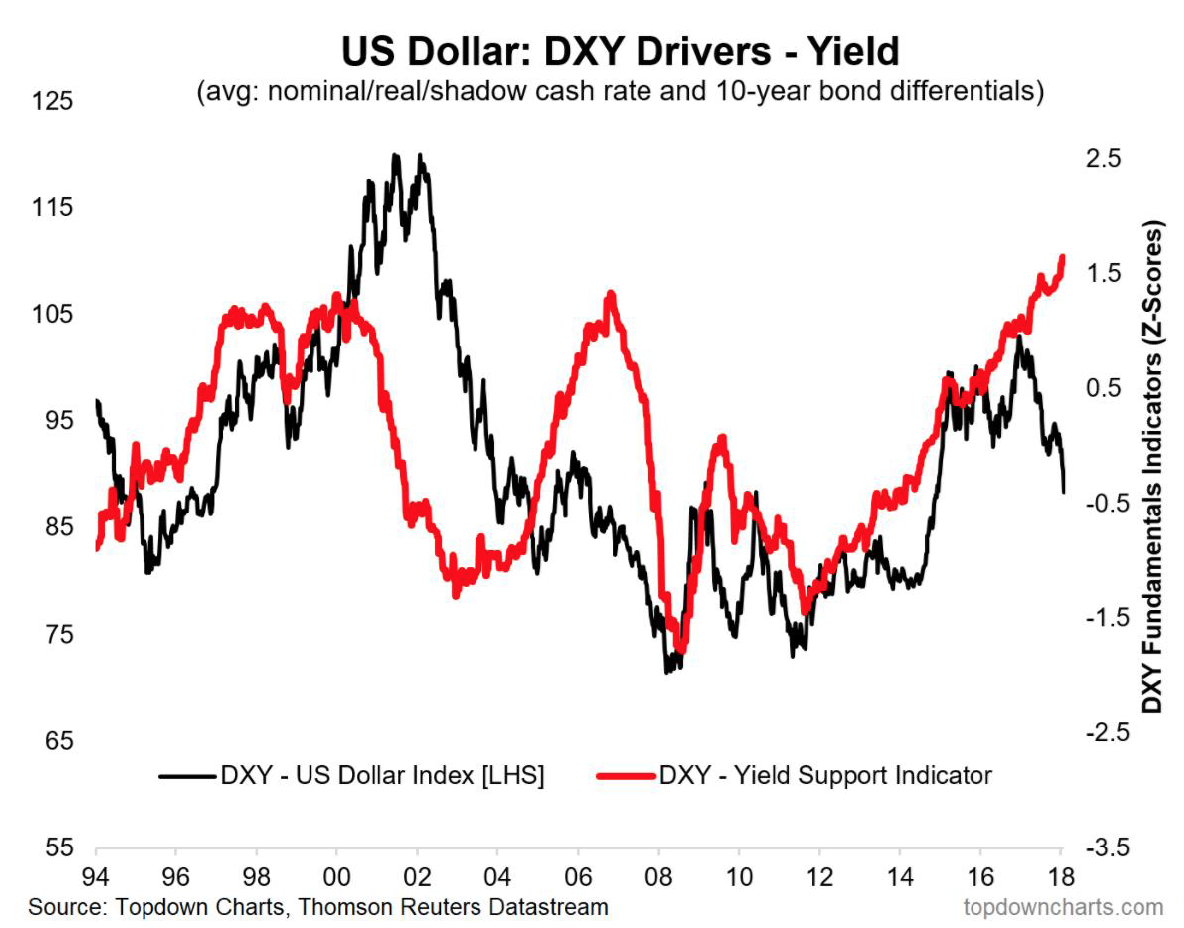
Now back to the story and point of my post. Often, but not always, the price of spot follows yield. The divergence with The US 10 year and USDJPY is a classic REJECTION of this rule. Some traders – erm…like me, often say it is only a matter of time before things snap back to the “norm” and the two-step dance resumes. Take a look at the 2005-2008 period. The yield average (nominal/real/shadow cash) is a leading indicator. All good in the hood. But it then becomes a coincidental one. Trouble ahead perhaps? It then forms into a lagging indicator. IT TOOK 3 YEARS BEFORE IT RESUMED RULE. WE ARE IN YEAR 1
Also, here’s a little wrap on jawboning in DAVOS: Mnuchin talks USD down, Draghi tries and FAILS to talk EUR down, Trump talks USD up.
The bottom line is the jury is out. Reversals rule so USD weakness could continue into next week. Be aware because USD bulls and bounce back believers can bleat all they want whilst saying it’s only a matter of time. They are quite correct – another two years of time so good luck with that.
Talking of risk – just watch it ok ?

Philosophy: "Define your risk, only then can you ignore it"
Read how Patrick got into trading here
- How to trade: A LEVEL - August 4, 2018
- USD mixed – a bit like me - June 5, 2018
- What is the market focused on ? Over to you trader. - May 29, 2018
Echoes of 03/04 as well Patrick when “twin deficits”/tax holiday took a hold
Nice one Si. Twin Defs certainly on my radar. 😉