
For this example I will use two of the more widely known and frequently used Oscillators – MACD Moving Average Convergence Divergence and the RSI Relative Strength Index.
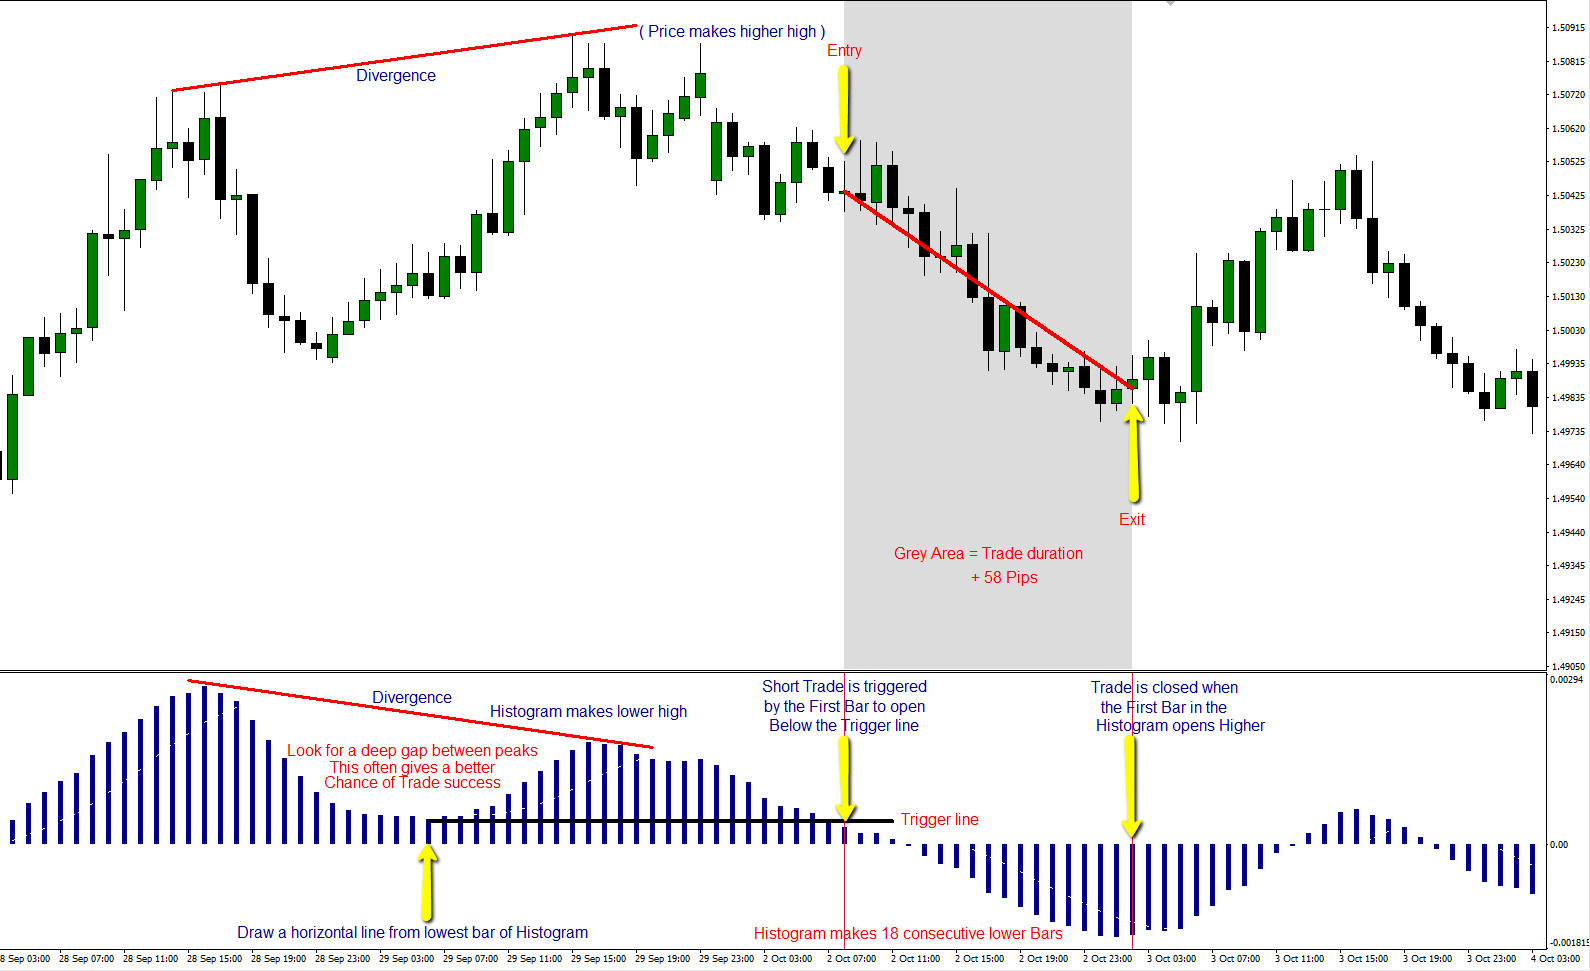
EURAUD Hourly MACD Method.
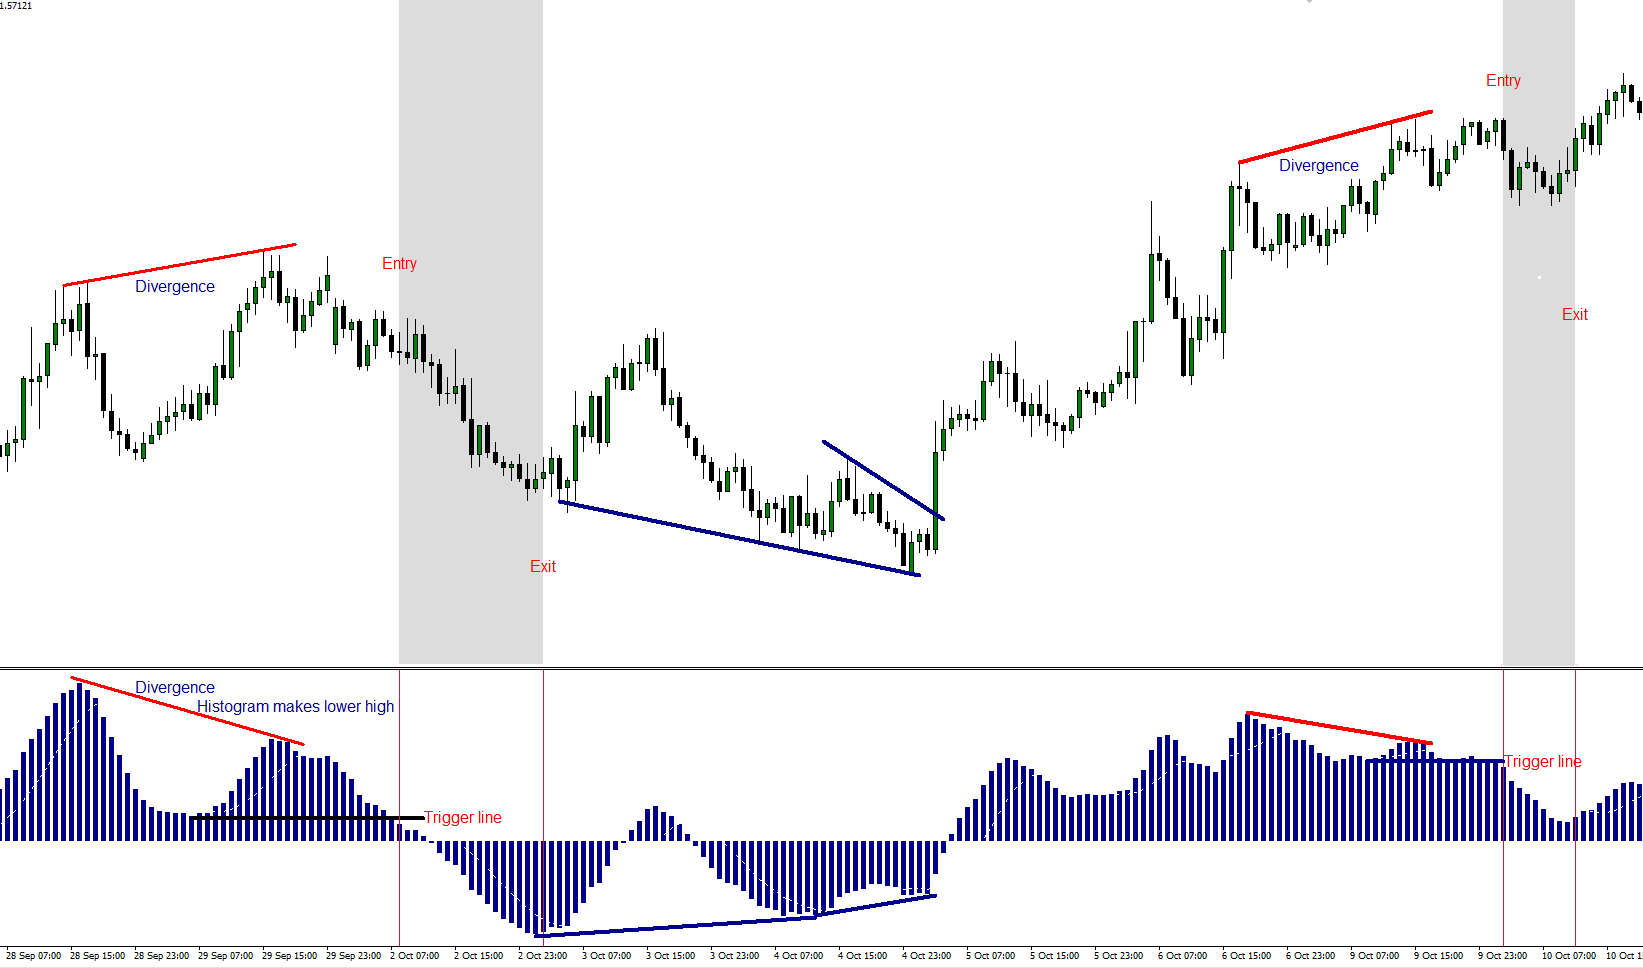
Another example below of a small win

EURAUD Hourly MACD Method
The following chart shows a wider view of the above trades with a Long trade set up (positive divergence) in-between the short trades highlighted by the blue lines – Worth noting that although price extended to the upside, the Bar count would have dictated exiting the trade very early.
EURAUD Houly MACD Method
On to the RSI .- Modify your settings to show a 40 and 60 level and disregard the standard 30 – 70. Simple rules for this one……….. Once a divergence has been identified, enter and exit using the modified levels — Use the 60 level to enter and exit short trades — Use the 40 to enter and exit long trades.
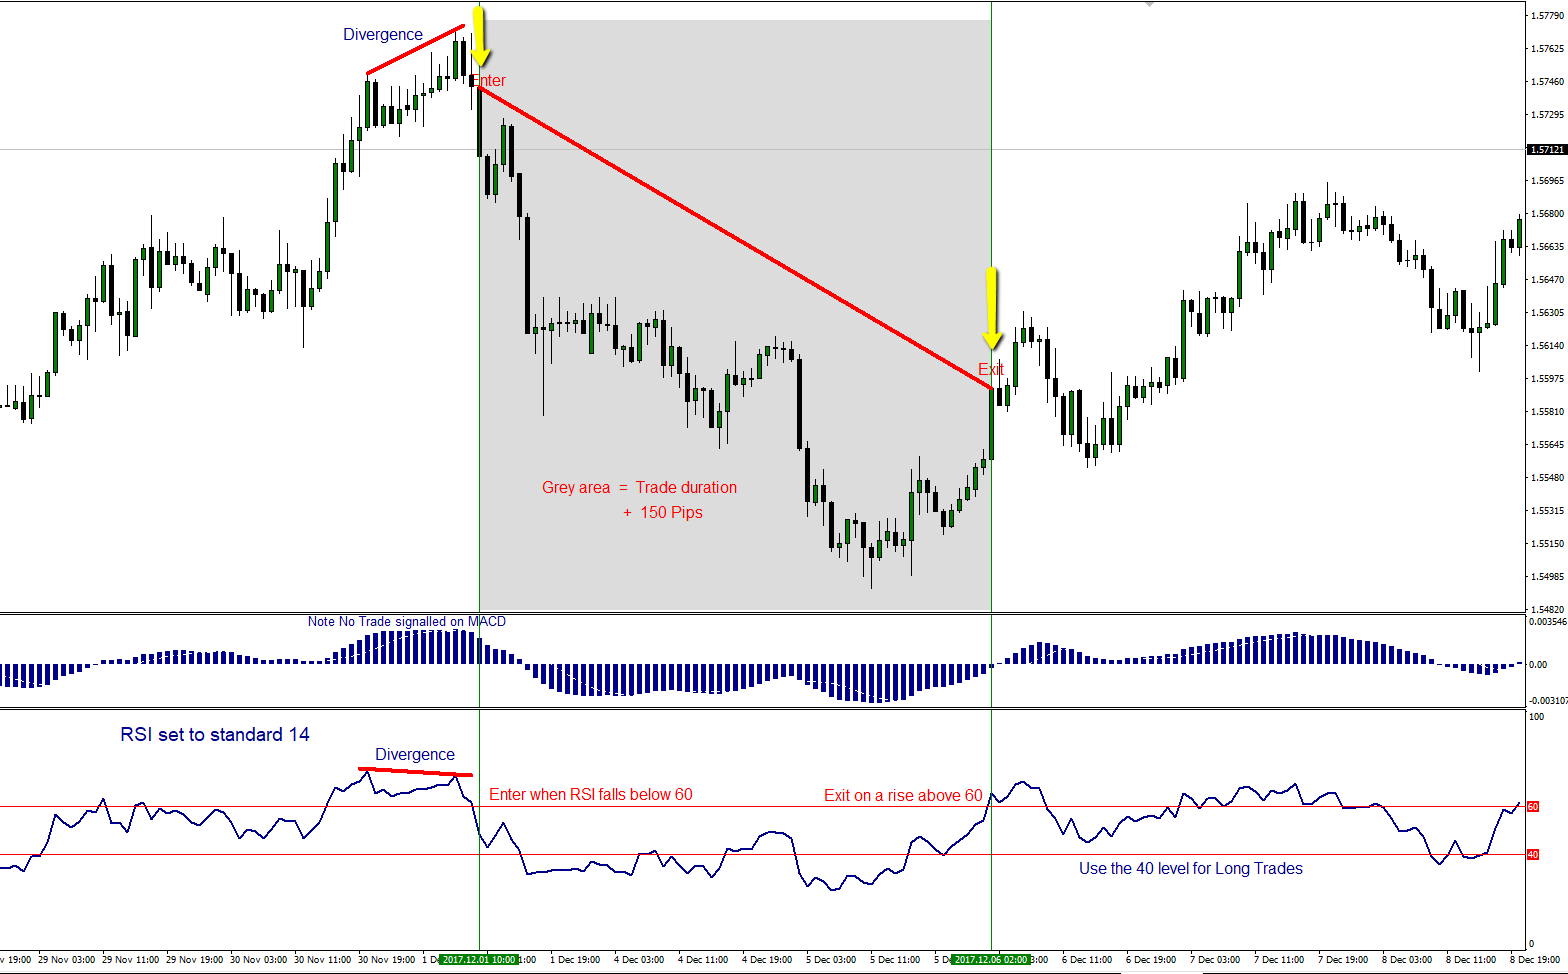
EURAUD Hourly RSI Method
The chart below shows a comparison between the 2 methods
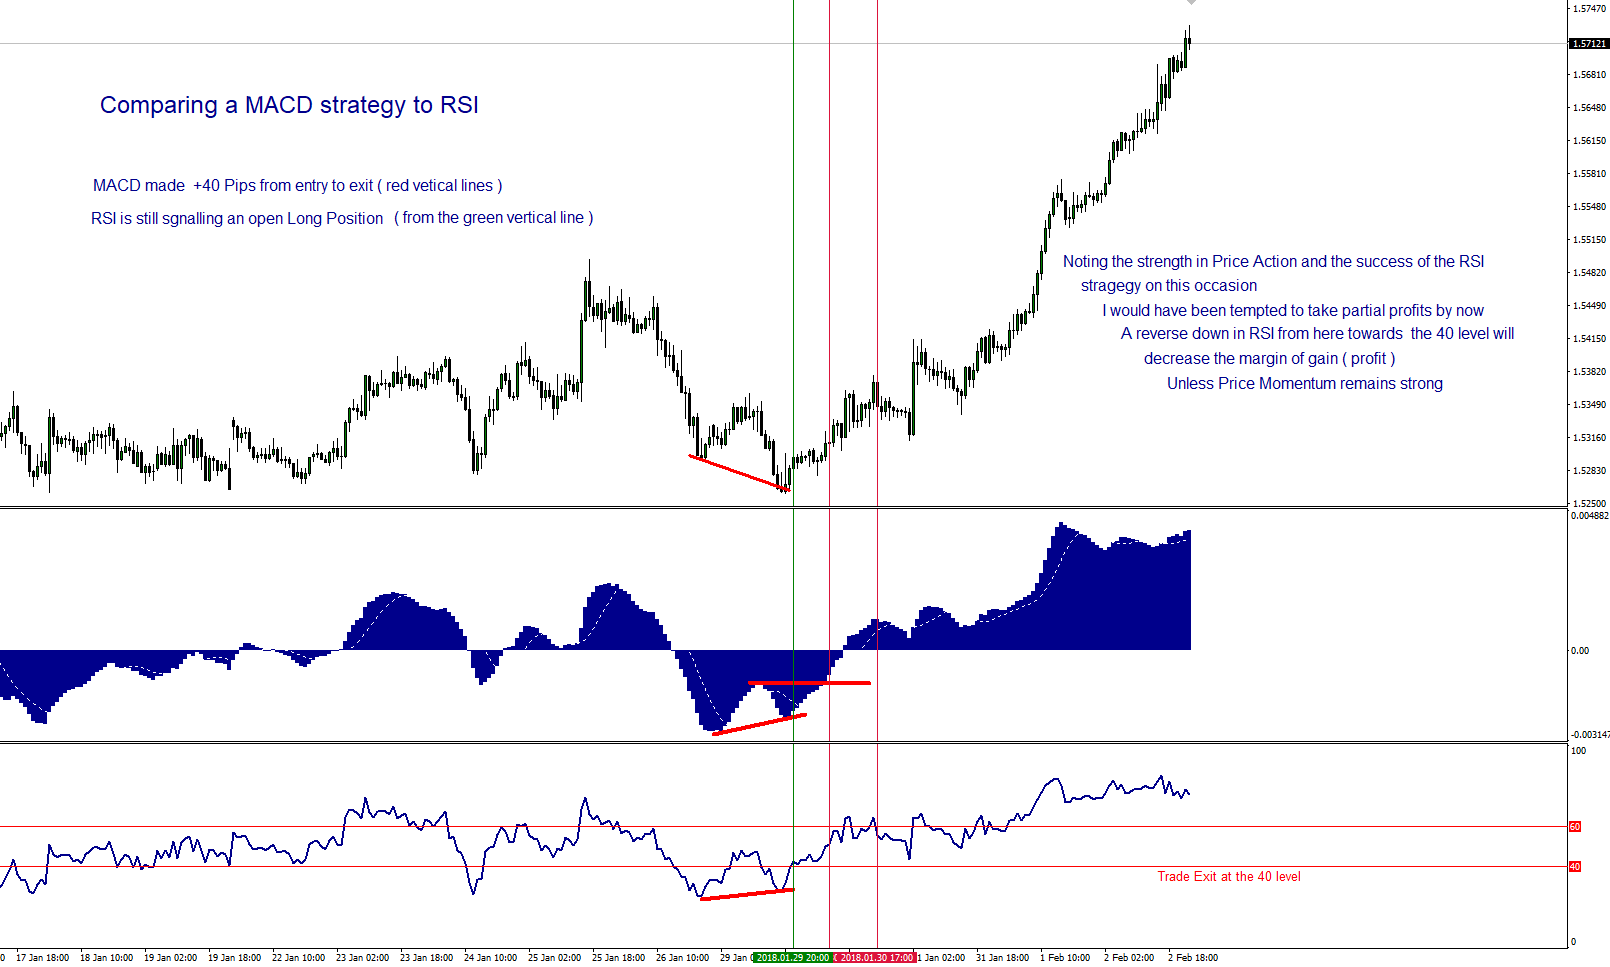
EURAUD Houly – Compare MACD / RSI
— IN CONCLUSION — Both give false starts. On back testing, many of the failures will be at the break even trade entry, a little frustrating but not altogether disastrous. I prefer the RSI strategy to the MACD. Far simpler and clearer to view on the charts with no Bar counting involved. I would not be tempted to use either of these methods on anything under a 1 hour timeframe as there is too much price noise in markets to chance picking out divergences successfully on anything less. Entering when the Indicators are stretched at visible highs / lows would also give a better chance of a successful outcome.
My thanks to Stefan in the comments who requested this post. We always like to go that extra mile here on ForexFlow to keep our friends and readers happy even when it interferes with my lunch break 🙂 It has given me an opportunity to review these Indicators again for myself ………….. That’s the great thing about trading – We never stop learning.

Philosophy: "Trading rules.....it most certainly does"
Read how Horatio got into trading here
- Silver – This weeks shining star, as predicted by ForexFlow - July 19, 2019
- 新年快乐 财源滚滚 大吉大利 A Happy wealthy healthy New Year to all our Chinese friends - February 4, 2019
- Gold and Silver – Glittering prizes? - January 28, 2019
or you can combine macd and bollinger ( standard deviation 3 ) and mfi … to time your entries have nice day
Absolutely Harry.
Plenty to pick and mix from. I would be hesitant to use momentum Indicators in tandem, but it’s surprising what you find when you start playing with things. The most important aspect when choosing indicators to match a job is to NOT be afraid to juggle around with the settings and take a more ‘unconventional’ approach.
yep i dont use them as main strategy buy they sure add a confirmation sometimes….i used to think them as alladin lamp but no they are not
https://www.tradingview.com/x/5bfoSlw3/ i think, time to short uj