
Price has been choppy since I entered my long trade at 77.21. The 1st target has been hit and I took part of my trade off .
Interesting to note that we have now reversed down again and are in the process of testing the neckline where I have added back. I am going to keep a tight stop on the new long trade and attempt to keep my core trade from lower levels in play. My second long is marked by the yellow arrow on the chart below. Link to my original post
If the second trade fails at the trendline / neckline, I will consider abandoning the trade and taking profits from my first position. This will be my line in the sand going forward.
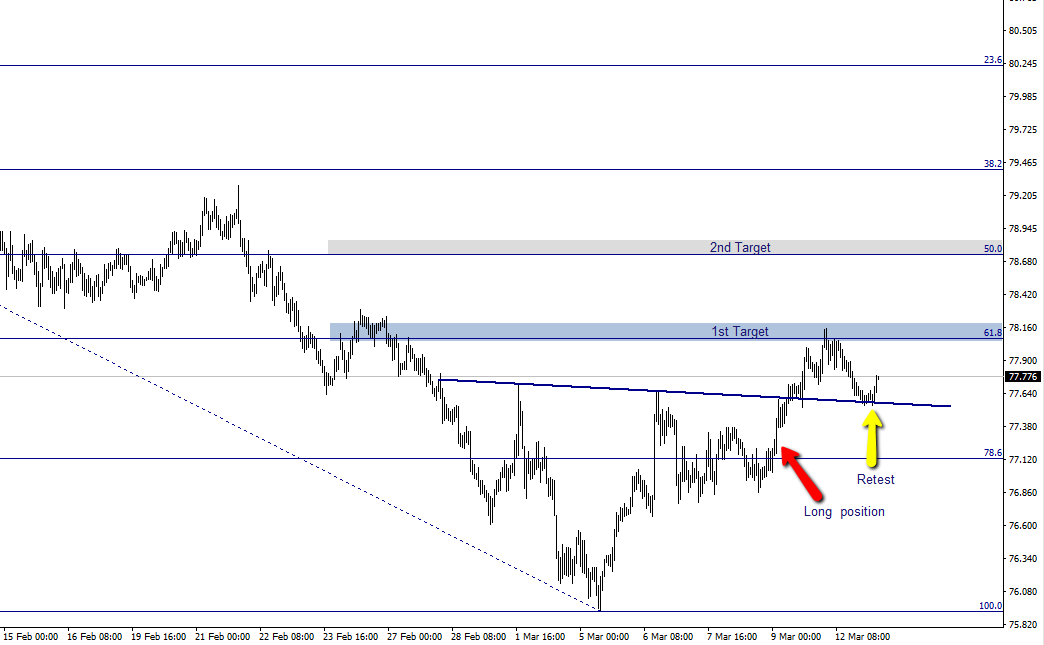
NZDJPY Hourly live
The original chart shown below
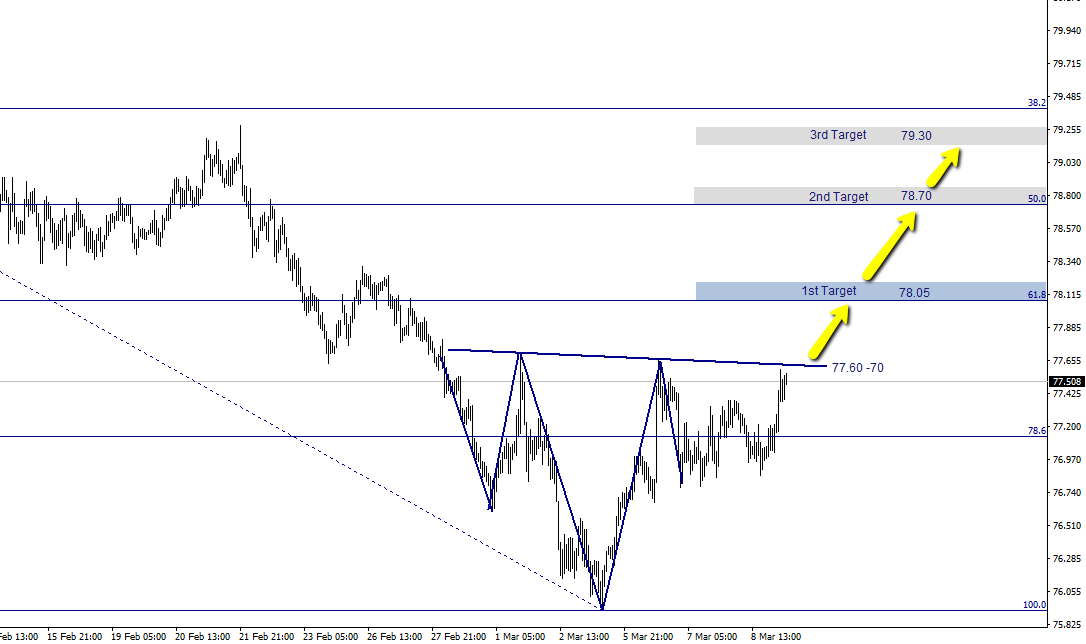
NZDJPY Hourly chart

Collects more scalps than Crazy Horse and newly crowned Bitcoin & Dow top calling master.
Philosophy: "Trading rules.....it most certainly does"
Read how Horatio got into trading here
Philosophy: "Trading rules.....it most certainly does"
Read how Horatio got into trading here
Latest posts by Horatio Dubsly (see all)
- Silver – This weeks shining star, as predicted by ForexFlow - July 19, 2019
- 新年快乐 财源滚滚 大吉大利 A Happy wealthy healthy New Year to all our Chinese friends - February 4, 2019
- Gold and Silver – Glittering prizes? - January 28, 2019
Took your suggestion yesterday and went long again
Nicely into profit now and moved my S/L to just under the H4 100 MA @ 77.697 (yeah I know its one of those imaginary lines)
ps As mentioned yesterday “beers are in the mail”
You’re from Tasmania John so I’m happy to forgive your little eccentricities and your imaginary friends as it cant be easy living upside-down 🙂
Seriously — Well played mate !
The PA stalled at the 61.8% = 78.081
took profit
will reload on retracement – working off 15m chart for retracement
it stalled around here on the last run up .- Fibs have that effect
Makes me think a push above will be with a little more gusto and intent when it eventually comes.
In hanging on for that scenario .
Super trade Johnners !