How to trade this bad boy.
This Thursday try your very best to trade a hawkish hold, or perhaps Sir would like a dovish hike with that, or maybe a nuanced indication of a delayed hike in Q3. And while your at it try trading the 3 months average rhetoric often spoken of by central bankers discounting the last 4 misses in data. You get where this is going.
Just so we are clear. CPI yoy .2 OFF, Wages .2 OFF and GDP having wrong written all over it. Carney’s interview at the BBC wasn’t dovish but he did not look confident. Also, none of this helps the key metric for me which is now standing at less than 25%
Nice work if you can OIS it.
Those of my followers on Linked In know that I’m a technical trader. That said I use a lot of confluence. OIS, correlations, monetary musings, sentiment, flow, positioning, and my favourite word RISK
Above all of this I like to read the market. Look at this chart. 8 big figures and 3 weeks of closing at the bottom of the weekly range.
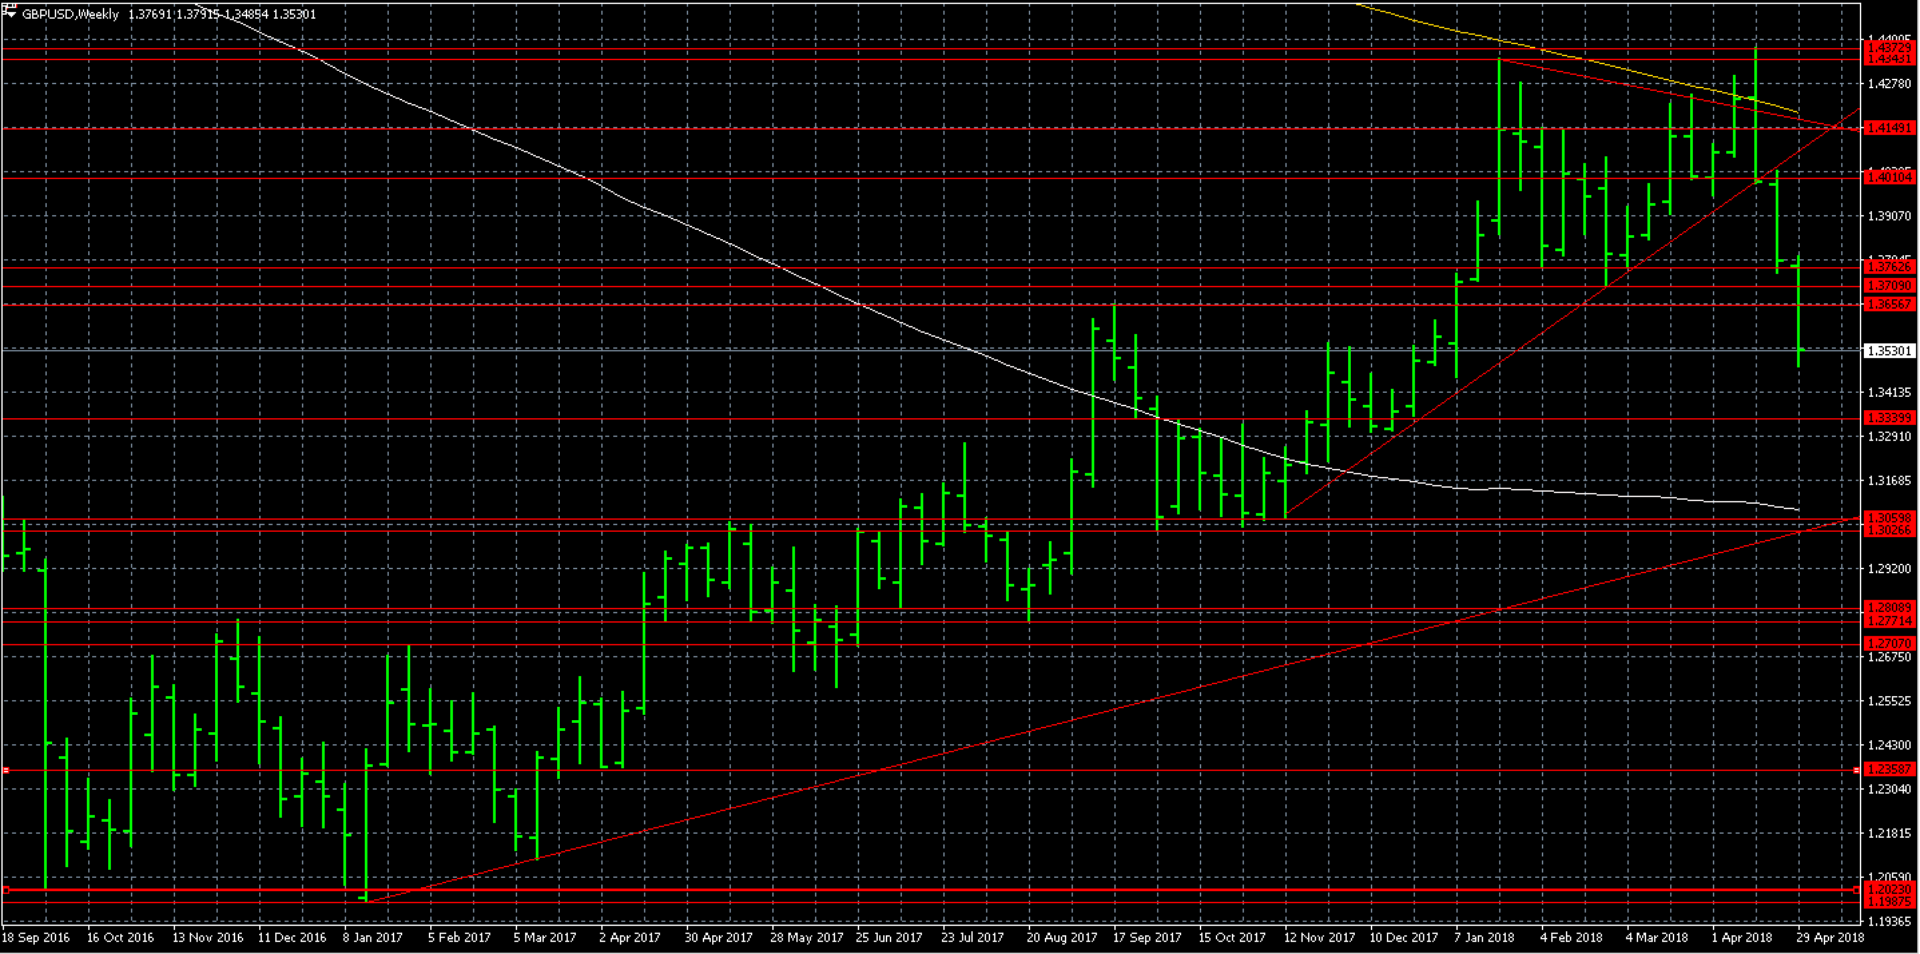
That is VERY bearish which means there are more sellers than buyers. Simple. Has the hike been priced out ? YES. Anything less than 25% in OIS has been priced out – that’s my rule so please find your own – just as long as it works for you.
I’m buying 1.3060 no matter what. Please read the chart because it tells you why.
I’m selling 1.3760 no matter what. Again the chart says everything.
Will i get filled ? Probably not. What is the best risk reward and trade for the big day? Buying CABLE at market Thursday morning but SMALLS. Will i do this ? Probably YES.
Job done. Thanks for listening.

Philosophy: "Define your risk, only then can you ignore it"
Read how Patrick got into trading here
- How to trade: A LEVEL - August 4, 2018
- USD mixed – a bit like me - June 5, 2018
- What is the market focused on ? Over to you trader. - May 29, 2018
Great summation Patrick, and difficult to flaw. May I ask if there is a free way to access the OIS data you cite? Thanks
Many thanks Ramy.
I’m lucky because a few mates are still spot dealers on the sell side.
I think tradeview might do it. I know they do yields….
Failing that you can always ping me on Linked in as i blog most days.
Cheers
P
Thanks Patrick will do some digging. It’s only recently I’ve been exploring yields, Libor, OIS etc to put some icing on my FX trades.
Still a technical trader at heart who also looks at the economic data/positioning.
If cable doesn’t turn right now, my next level of interest is around 1.3350.
Still think GBP is on an uptrend to 1.50+ longer term and- if I’m right- will open up a can of Brexit Lite to celebrate 🙂
Hi Ramy
Some advice for you. I’m a technical trader and have studied everything from Standard Deviation/Market Profile, to moving averages, to simple S+R
Everything you need to know is in the curve. Let’s take the US (the most powerful curve in markets)
Short end (2 year) is usually rate expectation.
Belly (10 year) rates again but more DXY and CPI
Back end (30 year) is CPI and GDP expectations
LIBOR-OIS does not affect spot unless theres imminent credit stress. The recent spread widening >50bps has been due to short term issuance and repatriation of USD. I know a lot of people in MM and have done extensive research to find a current link post the vol complex blow out in February. As yet there isn’t one.
Hope this helps
P
PS Now when there’s a bond conundrum or divergence (recent 10 year and DXY) there’s an exception to the rule. This doesn’t happen often,
Hi Patrick,
Sorry for the late reply.. And yes- that does help! Thank you.
Clearly an area where most retail FX traders are missing a trick.
Out of curiosity, how does the OIS at 25% stat then marry up with Bloomberg’s BOE rate hike probabilities? (see pic)
I’m guessing those projections can be derived from the curve?
Really appreciate your engagement 🙂
Ramy https://uploads.disquscdn.com/images/8cf2eb1513ceded4e44a9815626165808f54136395a0edd8e022aa3298e43ecc.png
OIS is a generic term. In The US it is Fed Fund Futures. In the UK I think it’s called Sonia….Anyway the Bloomberg % is a fair indication taken from this – my guess anyway.
Think of it as LIBOR but for central banks.
Got it- thanks Patrick. After today, looks like we’re 50/50 as to whether there will be a rate rise all year now. Yet cable still holding its ground.. 🙂
i am buying 1.10/1.15 NO MATTER WHAT….mate too much shit hitting the fun both ways…but still they should get an ecb alike QE* running and zero their rates…and not do the traditional/historic “follow the cousin”** method
*just for the “milkSHAKE” of it… not that QEs make any differences … experience shows QEs both from the FED and ECB went to (lets say) … “other projects” and not for what the “official line” was
** FED/americans …historically when the FEDs raise/cut the BoE does the same with little delay
Hi Kerdizo
Just so I understand. You like buying 1.10/1.15 but in what pair ?
Also, what has QE got to do with Thursdays decision? It’s all about OIS and the hike/no hike.
Thanks for the comments though !
Stay lucky
P
cable Patrick… i am talking in a more general view…since i dont see a hike “working” and thus looking at a more “longer term” view …. and taking in account based on each and every decision made
hope this makes sense
technically i have the view that on monthly charts and its much more clear especially if you take account data going as way far as 1970s/1980s
btw regarding Luck or (Tyche -Τύχη- in greek) is the daughter of Zeus (as always “an outcome” when he cheated Hera -this time with Aphrodite-)…. i guess thats why we are humble “humans” always say…. “”Man Plans, and God Laughs”” 😉
Buying 1.10 in cable you might be waiting a long time. That’s 10 big figs below the Brexit lows.
i still hold a good short position for a few years now which is spread well above between 1.60 – 1.70….
but i dont thing it will take that much… i almost got my tgt (1.15) during the and i believe it will not be that long before it will get “revisited” ….
Ps i am using funnymentals + technicals (sometimes CBA -crystal ball analysis- but my ball is still in service as we speak)