I was late to this one as I generally don’t like to hold positions over a weekend unless they are deeper in the money .
K-man gave a great synopsis of what to expect from data this week. So I will show (from a chart view) how I determine strength in a market, using USDCHF as a proxy for the USD.
The three charts below show the USDCHF on D1- H4- H1 timeframes.
- The Daily shows a shooting star candle on Friday. This could be a precursor to weakness going into the new week .
- The H4 shows a clear bear engulfing candle Further weakness ensued
- The Hourly gave the early clue with a textbook Doji (3 candle) combination .
The down move could be over for now, so I’m not advocating new shorts from here. This is just an example of how you can use candles/candle combinations on different timeframes (in a live setting) to determine direction and most importantly your risk .
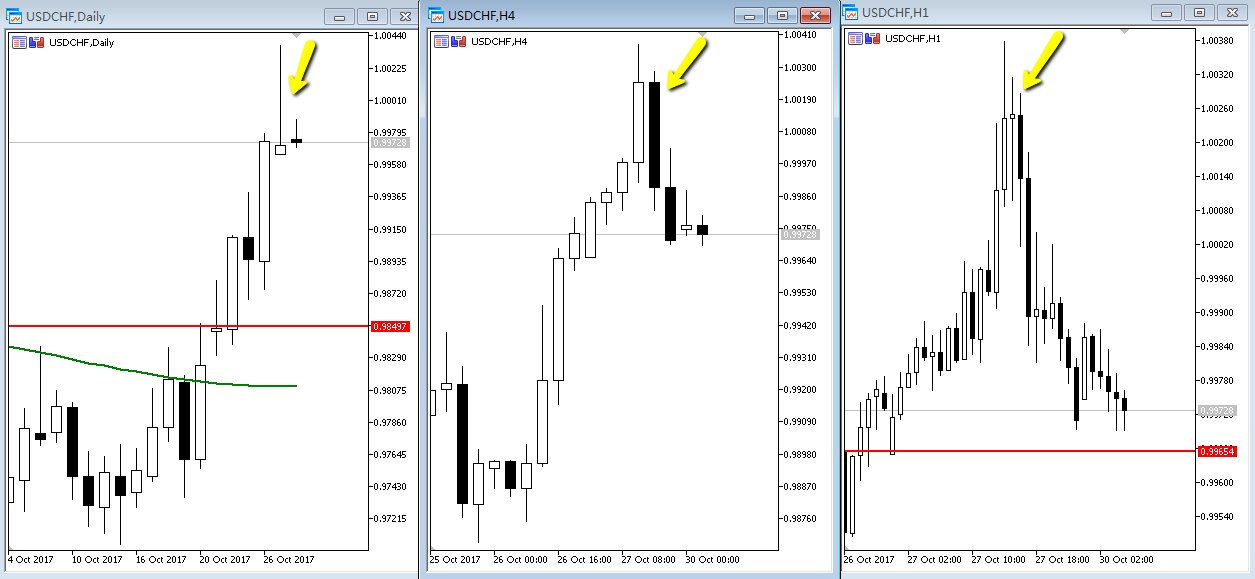
USDCHF-Candles 3 timeframes
Total of 274 pips post last week using my candle/Fibonacci methodology EURJPY – AUDJPY
Your comments are always welcome .

Collects more scalps than Crazy Horse and newly crowned Bitcoin & Dow top calling master.
Philosophy: "Trading rules.....it most certainly does"
Read how Horatio got into trading here
Philosophy: "Trading rules.....it most certainly does"
Read how Horatio got into trading here
Latest posts by Horatio Dubsly (see all)
- Silver – This weeks shining star, as predicted by ForexFlow - July 19, 2019
- 新年快乐 财源滚滚 大吉大利 A Happy wealthy healthy New Year to all our Chinese friends - February 4, 2019
- Gold and Silver – Glittering prizes? - January 28, 2019
Logical Dubsy. Can we develop it for other pairs?
Hi Koorosh.
Absolutely …I’m watching for small stregth in USD at this point in time .
I will be staying nimble as Mondays can be very difficult to guage direction, and best not to become too biased before the new week gets going proper 🙂
The Europe/London open is always important .
USDCAD is my pick for a short term long scalp trade
N.B post was edited to say weakness not strength (USD)
I use Fibs together with MA, but never been a candle man.
Great teaching tool Horie, so much so I have copied into my book tricks for future reference. THANKS
I will place some MA’s on my charts occasionally just for you Johnners 🙂
Can’t wait Horie to see an MA on one of your charts